Romania’s statistics office released detailed Q1 GDP figures on June 8, after the flash estimate indicating 6.5% y/y growth and a 5.2% q/q advance last month surprised analysts, who were expecting a weaker performance.
The details confirmed expectations that private consumption (+7.1% y/y and +3.5% q/q) was the main driver stimulating, on the formation side, the sector of services to households (+11.2% y/y and +6.2% q/q).
Households’ consumption alone pushed up the annual GDP growth by 5.1pp while the gross fixed capital formation and the inventory build-up contributed altogether only 0.5pp and the foreign trade had a neutral contribution on the utilisation side.
On the formation side, the sector of IT&C is worth singling out (besides services to households) due to its 1.8pp contribution to the 6.5% y/y growth, on the top of the 2.6% contribution of the sector of services to households.
While confirming analysts’ expectations about the drivers behind the robust economic growth in Q1, the detailed data released by INS leaves many questions unanswered.
Thus, the robust growth (in real terms) of the IT&C sector was partly explained by the sudden (9%-10%) drop in the prices in the sector — both in q/q and y/y terms. How was this possible and what it says about the sector’s productivity remain unclear.
Separately, the prices of the goods used by the government on behalf of households (‘individual final consumption expenditure of general government’) plunged by an impressive 30% q/q, supporting a significant part of the 3.5% q/q real rise of private consumption.
Thirdly, the rapid change of the seasonality assumed by the statistics office from one quarter to the other — an effect of the seasonal adjustment model — creates puzzling effects that made analysts of major banks revise their projections quite sharply.
The statistical discrepancies are quite wide and the developments often defy intuition. This means that the separate dynamics of sectors fail to explain the dynamics of the whole GDP.
One good illustration of this effect was provided by the April retail sales data released recently: the food, non-food and fuels sales rose by 1.6%, 2.2% and 3.6% respectively (m/m) while the overall sales figure edged up by only 0.3%.
In a similar way, the dynamics of the economic sectors would suggest an even stronger y/y growth rate - compared to the actual 6.5% rise. Such effects are normal for major one-off shocks (that divert the GDP from “normal” seasonal pattern) such as the pandemic lockdown or the surge in energy prices and the backward adjustments will be major as well.


Data
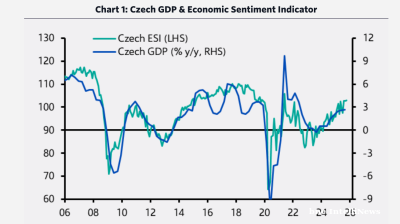
Czech growth accelerates as domestic demand-side pressure builds
The Czech economy delivered an unexpected acceleration in the third quarter, marking a clear shift from its earlier position as a regional underperformer to one of Central and Eastern Europe’s fastest-growing economies.
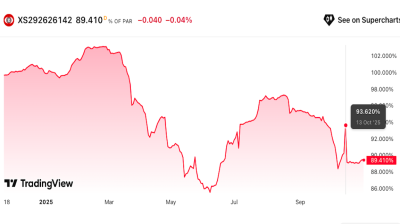
Eurobonds of Istanbul-listed Zorlu units offer attractive yields amid rating downgrades and no default expectation
Debut paper currently offering 14-15% yield.
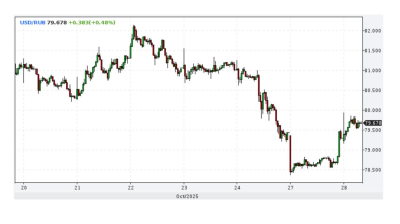
Ruble strengthens as sanctioned oil companies repatriate cash
The Russian ruble strengthened after the Trump administration imposed oil sanctions on Russia’s leading oil companies, extending a rally that began after the Biden administration imposed oil sanctions on Russia in January.

Russia's central bank cuts rates by 50bp to 16.5%
The Central Bank of Russia (CBR) cut rates by 50bp on October 24 to 16.5% in an effort to boost flagging growth despite fears of a revival of inflationary pressure due to an upcoming two percentage point hike in the planned VAT rates.
