Turkey’s official gross domestic product (GDP) expanded by 4% y/y in 1Q23, the Turkish Statistical Institute (TUIK or TurkStat) said on May 31.
The TUIK, as has become usual in recent years, is, according to its data series, on course to release full-year GDP growth of around 5%.
It is not advisable to plan, price or draw inferences based on TUIK data. There is widespread concern at methodologies employed by the agency.
Turkey has so far led the global inflationary period. Now, it is leading the stagflation, or "slumpflation", period.
Liam Peach at Capital Economics said in a note: "Turkey’s economy shrugged off the impact of the earthquakes in February and grew by 0.3% q/q (4.0% y/y) in Q1. GDP growth is likely to remain soft in q/q terms this year, but a continuation of President [Recep Tayyip] Erdogan’s policies will keep macro imbalances large and raise the risk of an altogether worse outcome."
| Main Macro Indicators | 2019 | 2020 | 2021 | Q1-22 | Q2 | Q3 | Q4 | 2022 | Q1-23 |
| GDP Growth (y/y, %) | 0.9 | 1.8 | 11.0 | 7.3 | 7.6 | 3.9 | 3.5 | 5.6 | 4.0 |
| Electricity Consumption (y/y) | -0.6 | 0.1 | 12.4 | 4.6 | 1.2 | -3.1 | -6.0 | -1.0 | -5.3 |
| Employed (active, mn) | 26.7 | 24.1 | 27.0 | 27.9 | 29.7 | 28.5 | 30.5 | 29.3 | - |
| Population (mn) | 83.2 | 83.6 | 84.7 | - | - | - | - | 85.3 | - |
| GDP (per capita, $) | 9,127 | 8,599 | 9,539 | - | - | - | - | 10,655 | - |
| GDP (current, TRYbn) | 4,318 | 5,047 | 7,209 | 2,496 | 3,419 | 4,258 | 4,801 | 15,007 | 4,632 |
| GDP (current prices, $bn) | 760 | 717 | 803 | 180 | 219 | 242 | 263 | 906 | 245 |
| Inflation (y/y, %, eop) | 11.8 | 14.6 | 36.1 | 61.1 | 78.6 | 83.5 | 64.3 | 64.3 | 50.5 |
| Lira-loans (%, y/y) | 13.9 | 43.3 | 20.4 | 33.2 | 55.7 | 68.6 | 80.4 | 80.4 | 86.0 |
| Policy Rate (%, active, eop) | 11.4 | 17.0 | 14.0 | 14.0 | 14.0 | 12.0 | 9.0 | 9.0 | 8.5 |
| CA Balance ($bn, Oct) | 1.67 | -35.5 | -14.9 | -19.2 | -13.3 | -9.3 | -10.8 | -48.8 | -23.6 |
| CA Balance/GDP (%) | 0.2 | -5.0 | -1.9 | -10.7 | -6.1 | -3.8 | -4.1 | -5.4 | -9.6 |
| Budget (TRYbn, Nov) | -124 | -173 | -192 | 30.8 | 62.8 | -139.1 | -93.6 | -139.1 | -250.0 |
| Budget Balance/GDP (%) | -2.9 | -3.4 | -2.7 | 1.2 | 1.8 | -3.3 | -1.9 | -0.9 | -5.4 |
| USD/TRY (eop) | 5.95 | 7.44 | 13.3 | 14.7 | 16.7 | 18.5 | 18.7 | 18.7 | 19.2 |
Table: Main macro indicators.
Data

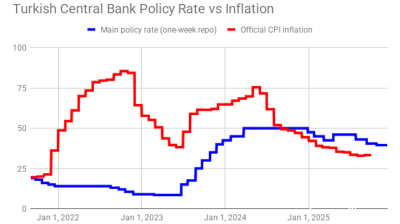
Turkey's central bank remains cautious, delivers 100bp rate cut
Decision comes on eve of next hearing in trial that could dislodge leadership of opposition CHP party.

Polish retail sales return to solid growth in September
Polish retail sales grew 6.4% year on year in constant prices in September, picking up from a 3.1% y/y rise in August, the statistics office GUS said.

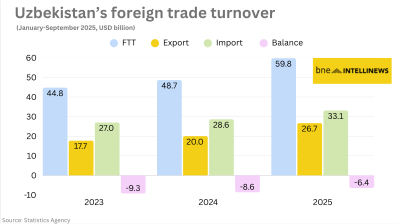
Uzbekistan’s nine-month foreign trade nears $60bn
Export growth of 33% and import expansion of 16% y/y produce $6.4bn deficit.

Hungary’s central bank leaves rates unchanged
National Bank of Hungary expects inflation to fall back into the tolerance band by early 2026, with the 3% target sustainably achievable in early 2027 under the current strict policy settings.


