Romania’s GDP (chart1, chart2) increased by 0.8% y/y in Q2 and 0.7% y/y in H1, according to the first detailed estimates of the country’s economic performance in the first half of the year published on September 6.
The figures confirm the August 14 flash estimate, which came as a big disappointment and prompted analysts to revise downward their full-year GDP growth projections to under 2%.
The implications of the change in methodology this year by the statistics office to deflate GDP for price changes are important and support expectations for a stronger full-year advance than the H1 performance would imply. But even so, growth rates above 2% are unrealistic and, in bne IntelliNews' view, a 1% growth rate is more likely – considering that the fiscal stimulus will be proportionally softer in H2, farmers expect weak crops and the absorption of EU funds is slower than expected.
Based on chain-linked real (volume) GDP calculations, which account for the change in the structure of GDP by sectors, from quarter to quarter, the annual growth would have been 1.5% y/y in H1 (+2.1% y/y in Q1 and 0.7% y/y in Q2) – double the 0.7% y/y officially announced, based on constant-weight methodology. Slower y/y growth rates in H2 (among others on low base effects) will dilute the 1.5% y/y advance in H1 bringing the full-year advance close to 1%.
The statistics office uses the chain-linked real (volume) GDP series to adjust the GDP seasonally (and further calculate q/q changes). But it reports y/y changes based on constant-weight real (volume) GDP. The chain-linked GDP data (volume, q/q and particularly y/y data) is more accurate compared to the constant-weight data that are based on weights from the base year that may be no longer relevant. Thus, the y/y changes reported by INS are not consistent with the more accurate q/q changes (and seasonally-adjusted real GDP series). For whole years (as opposed to single quarters), the discrepancy is negligible as the weights do not change a lot from one year to another. But far from the base year, the deviation from the base year's GDP structure can be significant, altering even the relevance of annual GDP growth calculated based on constant weight. Using 2020 as a base year poses even more challenges in terms of seasonality and economic structure (weights).
The detailed data published on September 6 broadly confirm analysts’ expectations about the individual contributions of each of the economic sectors: except for the cultural sector (which has a very small weight in total GDP), only agriculture (+10.9% y/y in value-added terms) and construction (+1% y/y) made significant contributions (+0.2pp and +0.1pp respectively) to the country’s gross value added )which advanced by only 0.2% y/y in H1 with the net taxes and subsidies adding another 0.5pp as fewer subsidies (for energy) were extended in 2024 compared to 2023.
It can be safely concluded that the country’s economic growth was driven, in the first half of the year, solely by the infrastructure projects financed from national and EU funds. The sharp increase in the (mainly the private) consumption (+4.2% y/y) and capital formation (+3.3% y/y) pushed up the imports (+4.0% y/y) while the drop in external demand (exports contracted by 3.3% y/y) dragged down the country’s output (GDP). There are no grounds to believe that capital formation (investments) are more stimulative as regards domestic production, compared to private consumption that is broadly believed to stimulate imports.

Data

Polish retail sales return to solid growth in September
Polish retail sales grew 6.4% year on year in constant prices in September, picking up from a 3.1% y/y rise in August, the statistics office GUS said.

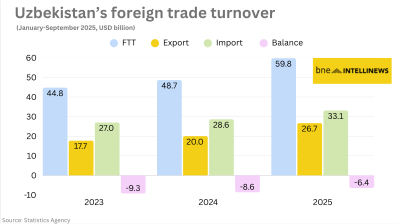
Uzbekistan’s nine-month foreign trade nears $60bn
Export growth of 33% and import expansion of 16% y/y produce $6.4bn deficit.

Hungary’s central bank leaves rates unchanged
National Bank of Hungary expects inflation to fall back into the tolerance band by early 2026, with the 3% target sustainably achievable in early 2027 under the current strict policy settings.

Germany slowdown weighs on Lithuania’s export-driven manufacturing sector
Lithuania’s economy remains highly sensitive to the industrial cycle in Germany, its third largest trade partner.


