Romania’s GDP per capita, expressed in purchasing power standards (PPS), increased to 72% of the European Union’s average last year — 3pp up from 2019 and 20pp up over the past decade, according to the first estimates published by the union’s statistics office, Eurostat.
The performance puts the country in line with the Baltic States — the group of countries that have boasted, among the union’s new member states, the most robust convergence towards the European Union’s average GDP and wealth levels. Lithuania’s GDP per capita rose to 87% of the EU average, marking the steepest (26pp) advance over the past decade. The other two Baltic States boasted robust convergence rates of 20pp in Estonia, to 86% of the average, and 18% in Latvia, to 72%.
In terms of the convergence level reached, Romania’s economy ranks 2pp below that of Hungary and 4pp behind Poland, but well above the economy of Bulgaria (55% of the EU average) or even Greece or Turkey (64% each).
When it comes to actual individual consumption (AIC) per capita, also expressed in PPS, Romania does even better: its AIC rose to 79% of the EU’s average, 25pp up from a decade ago. This was again the second-widest leap, after Lithuania (+29% and 96% of the EU average). By AIC per capita, Romania thus ranks within the Baltic States’ 72%-96% corridor, somewhat below Poland (83%) but well above Hungary (69%), while Turkey, Bulgaria and Serbia score weaker ratios of 72%, 61% and 52% respectively.
In the region, Hungary (69% of the EU average), Bulgaria (61%), and even Greece (78%) lag behind while Poland stands out with a strong 83% ratio.

| AIC, GDP at PPP | AIC at PPP | 10-yr change | GDP at PPP | 10-yr change | |||
| 2010 | 2020 | 2010 | 2020 | ||||
| EU 27 | 100 | 100 | 0 | 100 | 100 | 0 | |
| Euro area | 109 | 105 | -4 | 109 | 105 | -4 | |
| Belgium | 113 | 113 | 0 | 121 | 117 | -4 | |
| Bulgaria | 45 | 61 | 16 | 44 | 55 | 11 | |
| Czechia | 77 | 87 | 10 | 84 | 94 | 10 | |
| Denmark | 119 | 121 | 2 | 131 | 136 | 5 | |
| Germany | 119 | 123 | 4 | 121 | 121 | 0 | |
| Estonia | 61 | 79 | 18 | 66 | 86 | 20 | |
| Ireland | 103 | 94 | -9 | 132 | 211 | 79 | |
| Greece | 95 | 78 | -17 | 85 | 64 | -21 | |
| Spain | 93 | 87 | -6 | 96 | 86 | -10 | |
| France | 113 | 109 | -4 | 109 | 103 | -6 | |
| Croatia | 60 | 67 | 7 | 60 | 64 | 4 | |
| Italy | 111 | 97 | -14 | 106 | 94 | -12 | |
| Cyprus | 105 | 98 | -7 | 102 | 87 | -15 | |
| Latvia | 56 | 72 | 16 | 54 | 72 | 18 | |
| Lithuania | 67 | 96 | 29 | 61 | 87 | 26 | |
| Luxembourg | 141 | 131 | -10 | 260 | 266 | 6 | |
| Hungary | 63 | 69 | 6 | 66 | 74 | 8 | |
| Malta | 84 | 83 | -1 | 87 | 97 | 10 | |
| Netherlands | 124 | 117 | -7 | 137 | 133 | -4 | |
| Austria | 122 | 114 | -8 | 128 | 124 | -4 | |
| Poland | 70 | 83 | 13 | 63 | 76 | 13 | |
| Portugal | 88 | 85 | -3 | 83 | 77 | -6 | |
| Romania | 54 | 79 | 25 | 52 | 72 | 20 | |
| Slovenia | 82 | 80 | -2 | 85 | 89 | 4 | |
| Slovakia | 76 | 73 | -3 | 76 | 71 | -5 | |
| Finland | 113 | 114 | 1 | 118 | 115 | -3 | |
| Sweden | 119 | 111 | -8 | 128 | 123 | -5 | |
| Iceland | 116 | 124 | 8 | 121 | 125 | 4 | |
| Norway | 134 | 128 | -6 | 176 | 142 | -34 | |
| Switzerland | 134 | 123 | -11 | 166 | 160 | -6 | |
| United Kingdom | 119 | 110 | -9 | 111 | 102 | -9 | |
| Montenegro | 53 | 61 | 8 | 41 | 46 | 5 | |
| North Macedonia | 40 | 44 | 4 | 35 | 38 | 3 | |
| Albania | 34 | 40 | 6 | 29 | 31 | 2 | |
| Serbia | 47 | 52 | 5 | 39 | 43 | 4 | |
| Turkey | 53 | 72 | 19 | 53 | 64 | 11 | |
| Bosnia and Herzegovina | 39 | 43 | 4 | 30 | 33 | 3 | |
| United States | 160 | 156 | -4 | 147 | 136 | -11 | |
| Japan | 106 | 97 | -9 | 106 | 91 | -15 | |
| source: Eurostat |
Data

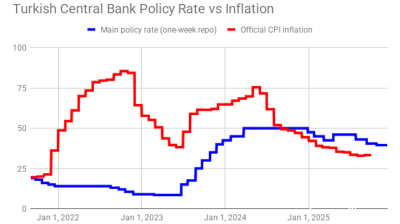
Turkey's central bank remains cautious, delivers 100bp rate cut
Decision comes on eve of next hearing in trial that could dislodge leadership of opposition CHP party.

Polish retail sales return to solid growth in September
Polish retail sales grew 6.4% year on year in constant prices in September, picking up from a 3.1% y/y rise in August, the statistics office GUS said.

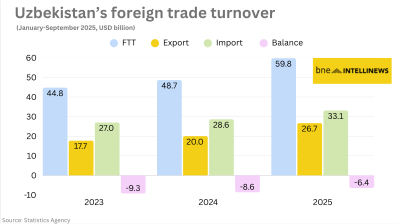
Uzbekistan’s nine-month foreign trade nears $60bn
Export growth of 33% and import expansion of 16% y/y produce $6.4bn deficit.

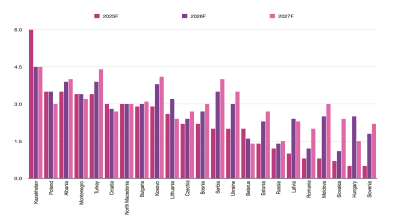
Hungary’s central bank leaves rates unchanged
National Bank of Hungary expects inflation to fall back into the tolerance band by early 2026, with the 3% target sustainably achievable in early 2027 under the current strict policy settings.


